Good morning readers,
most markets are closed over the weekend. As some of you know I am momentarily far more interested in trading and observing non-crypto markets for the time being, as major developments take place there that has and will continue to have its impacts on crypto in the future. As these markets are at a rest right now, it is time for a weekend update.
Amongst other things, the following questions will be explored in this report:
What triggered the selloff in crypto and other major markets in the past week
Is the anticipated bounce to 10.5k to be trusted?
What can we further expect in the coming week(s)?
The Selloff in BTC
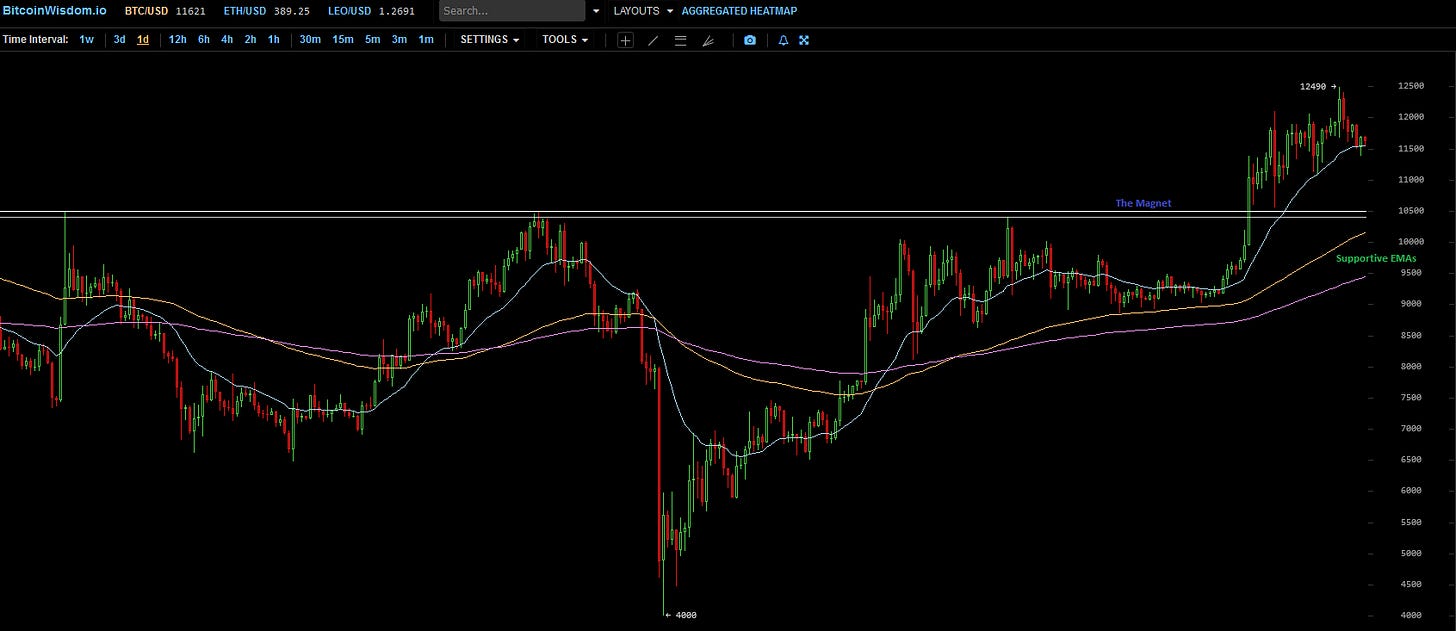
As a departure point, let us take a look at the BTC chart from previous report:

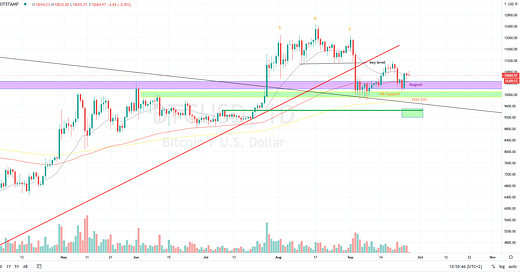
After writing the report the market did build several additional lows just above the critical $11,100 mark, increasing the significance of this level even more. Additionally, a clear Head & Shoulder Top pattern developed with an entry short at the exact same level which was an excellent trade into the 10.5 - 10k support.

The market penetrated support, but price managed to be absorbed by buyers at these levels. The EMA bundle below held nicely as well, adding to the assumption that market has confirmed and respected this critical support zone for the time being, thus providing a buy opportunity for those patiently waiting for such a dip to occur.
In the Meanwhile: Legacy Markets
Across the board, markets went downhill in the past week, offering great rewards for those eager to short at respective levels. Among them, GOLD (XAUUSD) offered a great setup with a symmetrical triangle breakdown, thereby losing support of the old All-Time-High levels from 2011.

Moreover, EURUSD formed a wedge which quickly turned downwards, got retested and then broke down violently, initiating a selloff that is still in the process of developing. More importantly, EURUSD has not only invalidated its uptrend by turning Higher Highs/Higher Lows into Lower Highs/Lower Lows, but price also lost support of the major trendline on the Weekly, adding to the selling pressure that can currently be observed in this market.

Stock markets like the SPX generally suffered significantly as well, with the breaking a longerterm trendline to the downside with crossing EMAs on the 4Hour chart. Although I am no fan of charting stock markets, it is important to note that those markets experienced a likewise selloff and was not limited to crypto at all.

Strength of the Dollar
It is fair to say that the the common reason for such bearish conditions in many markets is the increasing strength of the US Dollar Index, which after a prolonged uptrend formed a first bottom pattern that got confirmed during the week, offering an opportunity to go long.

Markets generally reacted bearish to this break. As the dollar remains the leading world currency, almost all pairs are valued against the dollar, which increases selling pressure in those pairs, like BTC/USD, XAU/USD, EUR/USD.
The key question therein is whether the strength of the dollar will continue in the next week and beyond. A rising dollar will be interpreted as bearish for crypto as such, as in addition to the standard determination of supply and demand, the stronger dollar increases selling pressure quite significantly.
As we look at the chart above, it can be argued that the target of the iH&S pattern has already been reached. In addition, the wick from March of this year now acts as a resistance which might stop this shortterm uptrend. However this needs further confirmation that might show up in the beginning of next week, as markets are closed until Sunday night. If this temporary uptrend stops at resistance, this might fuel more bullish price action in Crypto and other respective pairs. But this remains to be seen.
The Selloff in Crypto - Was that it?
If we exclude the increasing strength of the dollar for a moment and analyze the BTC chart exclusively, we might find further clues about whether or not this retest was sufficient, and in which direction the market will likely develop in the upcoming week.

From a Daily chart perspective, this retest was clearly sufficient. Price got absorbed in support, built a temporary rally, then retested this level again, this time forming a two-bar reversal which could be used as an entry long.
However, while this two-bar reversal has not yet been triggered, EMA 20 seemingly still acts as a resistance for the time being. Volume is generally weak. Ideally, we want to see increasing buy volume on rallies from support and diminishing volume on selloffs - but both did not occur.

Both the selloff from the $11,100 Lows and the following reaction to the temporary pullback have been quite strong, as indicated in the chart above. The lack of bullish volume and the strength of these selloffs are somewhat worrying, as it could indicate further (lower) retesting is needed. Note in the picture below, the strength of the breakdown, the complete lack of volume on the pullback, and the rejection at EMA bundle in the 4 Hours chart. Without further and violent strength of bulls, this rather looks like an additional breakdown needs to occur.

In a Nutshell
Most markets right now are totally reliant on the strength of the dollar and will continue to do so in the coming weeks and thereafter. The shortterm fate of crypto will largely be dependent upon further developments in the US Dollar Index, so this chart should be closely observed.
If the dollar continues to rise, the likelihood of BTC further breaking down increases significantly. On the other hand, if the resistance in the US Dollar Index is being respected, this might open the doors for a rally in BTC as the support has already successfully been tested. Which of the two scenarios will eventually unfold cannot be said at this time, as more data is needed - a battle that will occur in the upcoming week.
Bullish Scenario
With a successful trigger of the two bar reversal on Daily, we might see bulls coming back strongly with a break above the trendline as indicated below. Such break should occur with rapid movements to the upside with significant buy volume. A break above $11,200 High could open the doors to a renewed rally. However, given the current circumstances of the markets in general, I see this rather as a lower-probability scenario.

Bearish Scenario
Given the weak price action and the general conditions of the markets, the bearish scenario is of higher probability for the time being. In the case of a breakdown, another retest of the 10.5 - 10k support zone would be likely, where a new base of support and bullish price action with decent volume should form. In case this support does not hold this time, we would quickly enter dangerous territory.
Additional levels of interest would be the EMA 200 on Daily (currently at $9,836), the weekly trendline retest ($9,726) and the breakout point from previous rally at around $9,500. Trading below these respective levels will likely open the gates for a more serious and prolonged selloff.

Summary
Although the retest of support has been sufficient for the time being, there is more risk at hand, depending on the further developing of the Dollar Index. With the information currently available, no definitive call can be made, as the information needed will be provided with more price action, after markets have opened in the beginning of next week. Generally, caution is advised and it is imperative to develop action plans for both scenarios outlined.
Observing the development of the US Dollar Index will be critical for understanding global and crypto markets, so a close eye on this chart is definitely encouraged.
Stay safe, and have a great weekend,
CY


