Dear readers,
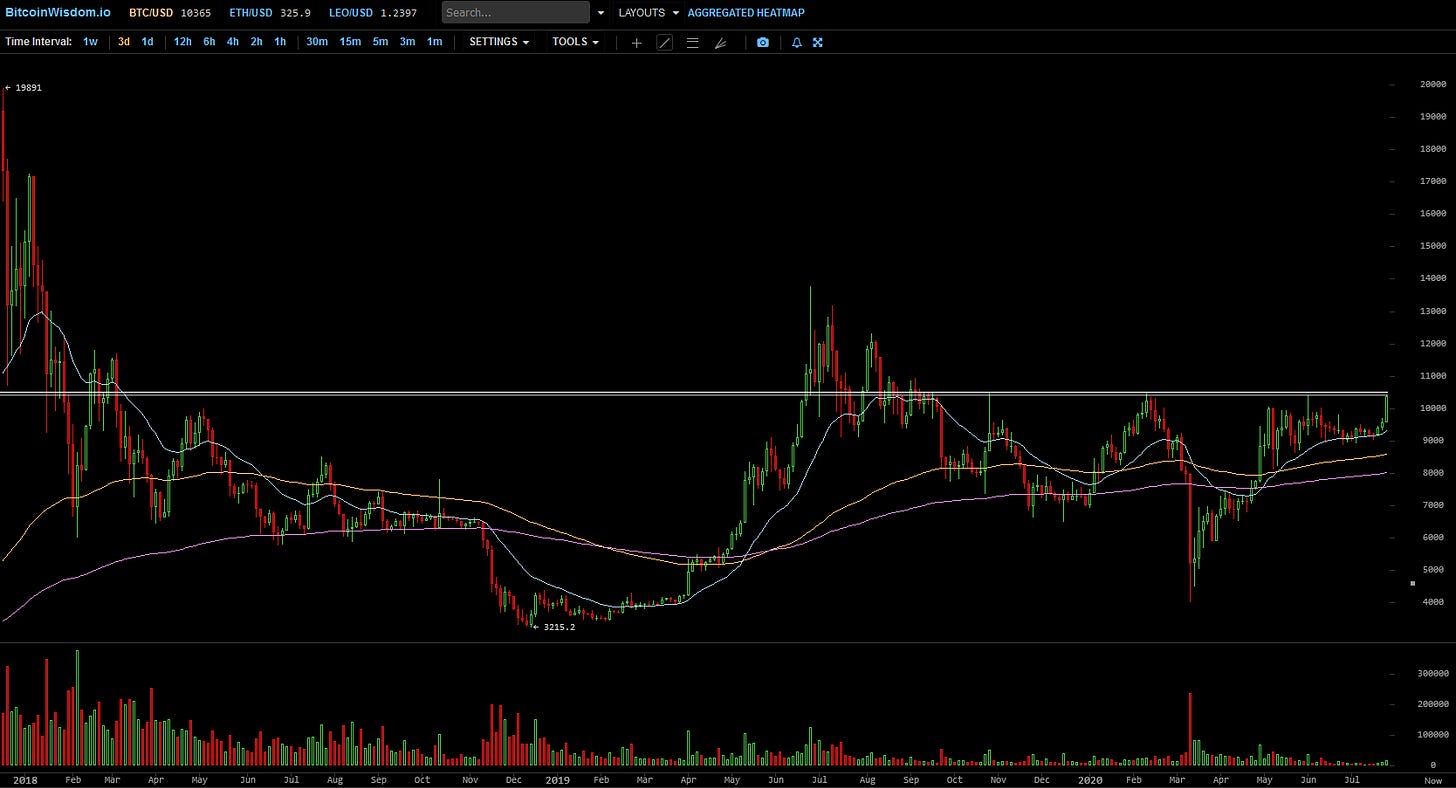
in reference to the rather compressed and straight-forward report from four weeks ago, i would like to comment on the market structure that has manifested after the initial break of the critical level of $10,500. Lets do a quick flashback to previous post to get some context. After careful analysis (see previous reports) we concluded that:
If $BTC manages to take out the level of $10,500 we will very likely see a large impulsion towards the 12k-13k zone. The amount of stop-losses just above $10,500 will fuel this move, while bears will additionally turn their positions further driving up the price.

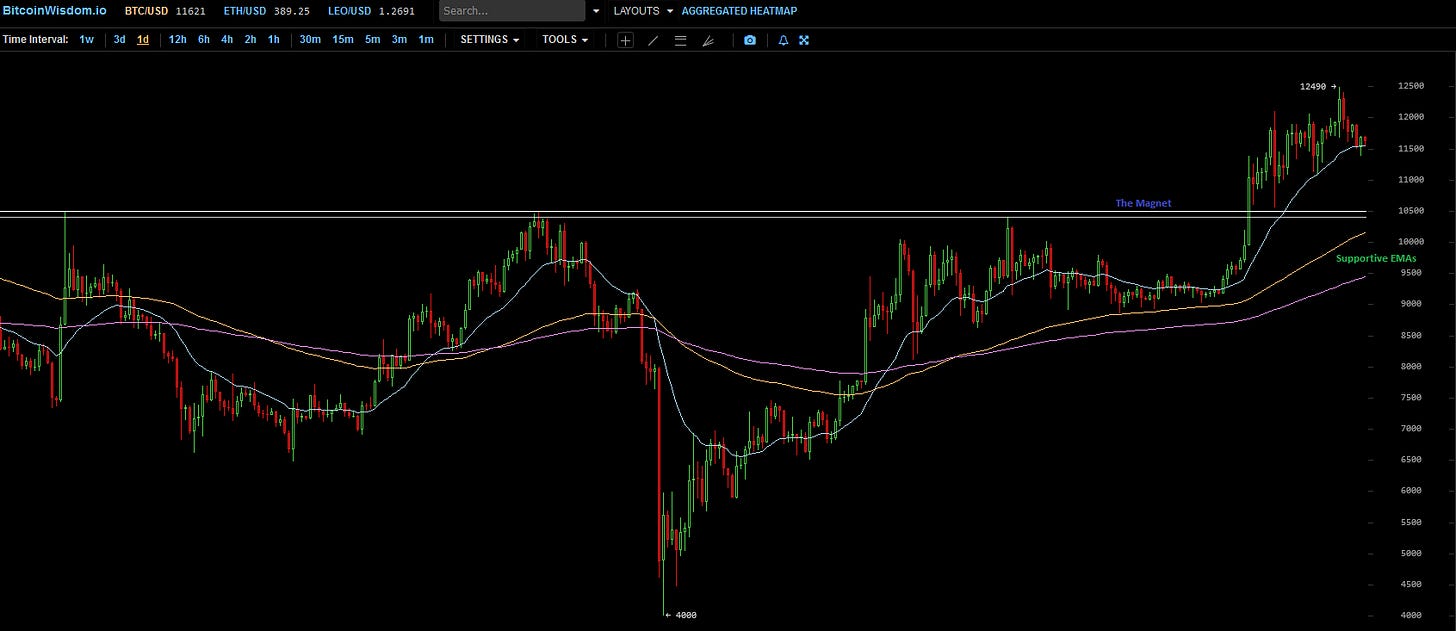
Flash forward to today, one month after the initial break, I think it is fair to say that the target range of 12k - 13k has been appropiately hit with a local top around $12,500.

However despite this range having been hit, the trigger of 10,500 has failed to produce a breakout in an intensity that I wished to see from such pattern. Instead of building a large, clean and rapid impulsion into the target area, price moved slowly, but steadily upwards, producing a lot of wicks on both sides of the candles, making the chart generally somewhat messy. But let us start in the beginning.
Spike, Channel, Trading Range
Most trends evolve in similar fashion: The initial breakout can best be described as the Spike-phase, in which demand is significantly higher than the supply. As a result, price tends to rise without major testbacks, leading to a visible rally in higher timeframe charts. Strong bull bars without too many tails on top and only few weak retest are characteristic for this phase.

This phase is often followed by the channel, as the trend generally weakens over time after the initial catalyst, due to profit taking of early longs, and lower risk/reward ratio of newly entered long positions in trend direction, as the risk of getting stopped out increases significantly with higher altitude.

Following the channel phase, the trend most likely morphs into a trading range, in which supply and demand ultimatively determines the new “fair price” of the asset after the initial surge has taken place. In a trading range, both extremes of the range get tested repeatedly until market participants force another major break to occur in either direction, while odds are generally higher that the breakout occurs in the direction of the prevalent trend.

Naturally, from a higher timeframe perspective, both a channel and a trading range may end up being simple consolidations before the trend further resumes. It is worth to note that the trend may overskip the trading range phase entirely, if the channel manages to once again pick up momentum in trend direction. In this case, the channel acts as consolidation and enables another leg up, as demand continues to increase even despite higher valuations.
The key question to be answered is whether we are going to continue to surge in trend direction, or morph into a trading range before another attempt, and which situations/levels would lead to either of the two scenarios.
The Trend is Intact
With consecutive Higher Lows and Higher Highs, the trend structure is technically intact. Critical Stops of Longs have not yet been taken out. EMA 20 on Daily is supporting the price from below, while longerterm EMAs (100/200) are crossed upwards in favor of the Bulls.

There are however also reasons to believe that me may be in the process of morphing into a trading range instead:
The Magnet
As is usually the case with clearly defined entry levels, such as the key area of $10,500, this zone most often continues to be an area of high interest and becomes a magnet for future price action. Especially in the case of V-Shape reversals, the entry level will usually be retested in the later course of the trend.

In addition to this critical level, longer term supportive EMAs are located roughly in the same area on the daily chart, adding to the significance of this level, and increasing the interest in retesting this zone in the future.
Zooming into H4
Right after the initial spike, price action formed an Ascending Triangle, which is a bullish pattern. However, immediately after triggering, price collapsed back into the previous range, having trapped quite a number of late longs in the process, who are now holding losing positions. It is to be assumed that most of their Stopps are placed right under last Low around $11,100. However, as long as their Stopps are not being triggered, the unfolding of the pattern might still come to fruition.

What the Bulls need at this time is a HL/HH or HH/HL reversal to the upside before last Low at $11,100 can be triggered, as indicated below:

In the case of such successful reversal, the EMA 100/200 bundle would act as support, inviting in Longs looking for a good risk/reward trade. Assuming such reversal is successful, it would end the current consolidation and begin picking up momentum in trend direction towards a new Higher High.
If the $11,100 Low is taken out however, the trend structure would be no longer intact and we would enter a trendless phase, which generally increases the chance of entering a prolonged trading range, which in turn increases the likelihood of retesting lower support levels / magnets, such as the key level of $10,500.
In a Nutshell
After the critical break of $10,500, the uptrend remains technically intact. It is to be expected that we are currently trading in consolidation before uptrend resumption. Bulls need to protect the level of last Low around $11,100 to keep trend structure intact and avoid entering a prolonged trading range. Any Higher Low/Higher High reversal to the upside could rapidly end this move of consolidation and could act as an effective entry long in trend direction, hoping to generate a new Higher High in the process.
If price does not manage to sustain current valuations, and fail in reversing to the upside, a drop below the low of $11,100 would force the market to enter a trendless phase, as both Higher Highs and Lower Lows would then be present in the chart, without a clearly defined trend. As the likelihood of entering a trading range increases with such break, key levels of interest would be around $10,500 (breakout point) and EMA 100/200 on the daily chart, which both act as buying opportunities for the longterm trend.
Striving to be of service,
CY


Nice work
Your emails are the only ones I always open without thinking. Thank you! :)