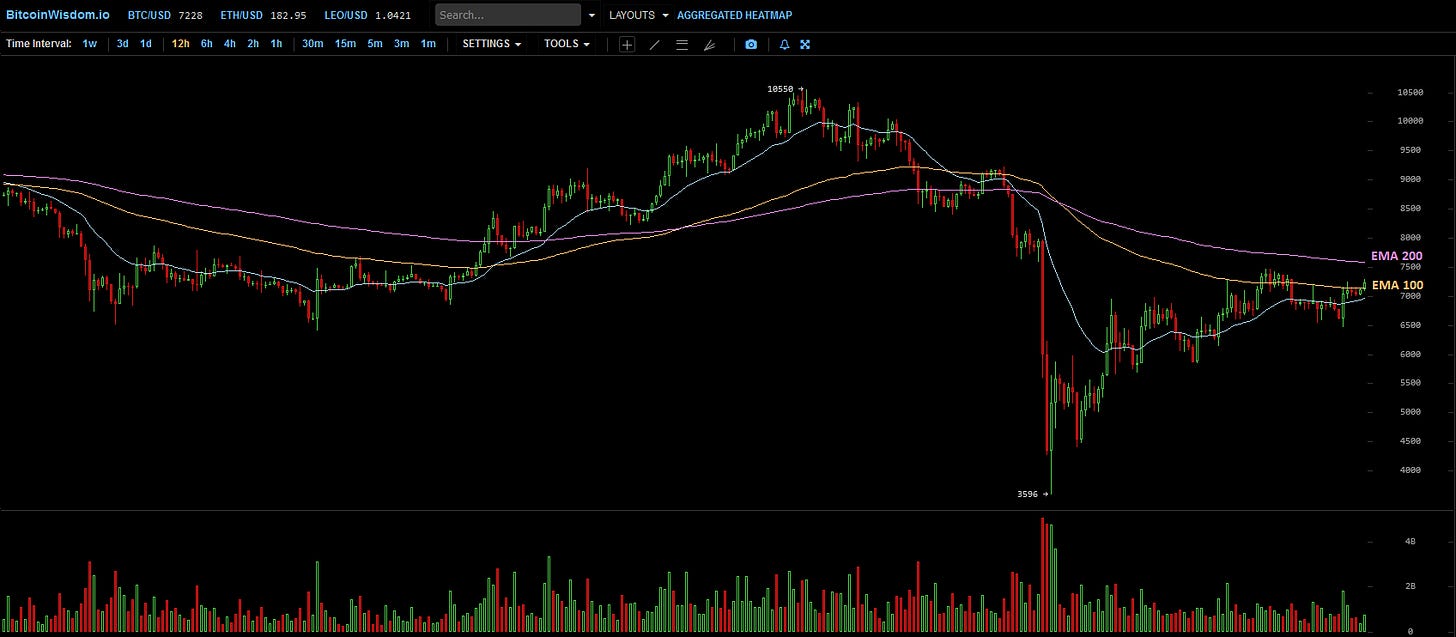
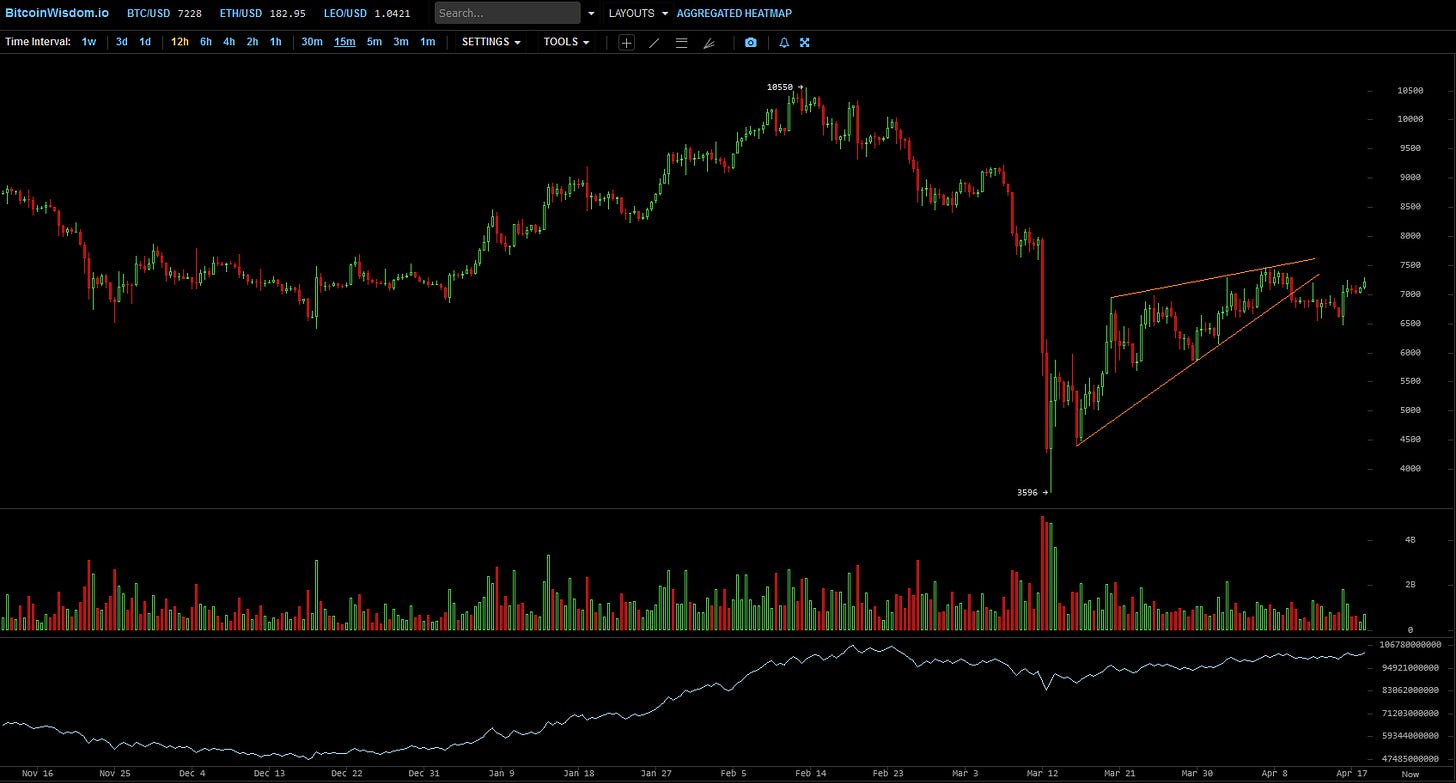
After having slowly broken through the Resistance of previous swing Lows in recent days, Buyers are continuing to eat through. Now greatly endangering Bear Stops on the way up, this situation might potentially lead to a chain-reaction/cascade, and a final flushing out of Bears. Due to height and significance of the current structure this is considered high risk territory; Volatility needs to be expected, possibly to both sides.

From the looks of it, this is still just a corrective up move from a larger downtrend, retesting previous swing Lows on the left of the screen. The volume on this presumably corrective move is not significant, albeit it shows slightly more interest in buying. The normal order of things - assuming the downtrend is still intact - would be a breakdown of this corrective move in order to resume the trend down. This has not happened, and it must be questioned whether or not it will. It is interesting to note that the OBV is already at levels almost equal to the $10,500 Top in February. This means that Bitcoin is being accumulated at lower levels, which is a bullish thing.

We can see that we have not only retested previous swing Lows, but in fact slightly eaten through, now trying to recapture these levels and turning them into support. This is what is happening right now, and time will tell whether this recapture will turn out to be successful and break out strongly to the upside as a result of this newly gained confidence - or if we lose these levels again and break down after this breakout has failed.

We do have more Resistance overhead, namely the zone between EMA 100 and 200 on 12h which are currently crossed downwards, due to the violent drop down several weeks ago. In a healthy downtrend this zone is used to add on to Short positions and to open new Short positions at the top of a corrective move, expecting a breakdown from these levels to occur soon IF the trend is still valid.

The Rising Wedge structure in which this correction is taking place has already been broken to the downside, but got bought. Which means that Shorts already entered the market, expecting a breakdown, having their Stops placed above recent High at $7,475.
A takeout of that High could lead to massive covering of Shorts and buying on volume leading to a strong rally, especially as buyers have already eaten through the before-mentioned Resistance levels of previous Lows. In simply terms, a takeout of the $7,475 High would invalidate the Rising Wedge, pushing out Bears out of their positons while inviting Longs buying the Bear’s pain. Bears might also be tempted to turn their positions to Bull as they do no longer expect to see another leg down as they have in the past days and weeks.

There is more doubt about the nature of this correction. The indicated Head & Shoulders pattern has seemingly broken to the downside, but got bought on two occasions, indicating the breakout has failed. We know that patterns that get invalidated can act as an entry in the opposite direction instead. Here as well, taking out the $7,475 High would stop out remaining Bears and officially invalidate this Top pattern for the time being, increasing the chances of a strong rally as a result of it.

The Daily chart shows a similar outlook: Still trading in Resistance of previous Lows in a presumably corrective move. There is significant overhead Resistance remaining with EMA 100 and 200 at levels $7,600 and $7,900 respectively. Price is now attempting to retest these levels at which point it will be decided whether the downtrend holds or if the trend has turned to bull. The structure itself seems corrective/bearish, but does not outrule a violent pump beginning from these levels, recapturing the mentioned EMAs, and turning them bullish again. Needless to say, markets would be most surprised by a very strong breakout to the upside, as Bears are still expecting another leg down.
Some thoughts
At this stage, while continuing to slowly cut through the overhead resistance, Bulls cannot allow weakness and must continue buy up any dump-attempt as they did in the previous days and weeks. In order to break the remaining Resistance overhead, Bull must now attempt to go parabolic - preferably on high volume - in order to kick this trend off and ignite the momentum to the upside towards halving and beyond. On the other hand, any failure of this breakout attempt will make the market very unstable and significantly increases the risk of breaking down violently.
Conclusively
Strength of Bulls seems to continue, slowly moving up in what should be a correction but perhaps is not. Traders and investors begin to question whether the trend is still down or whether it has perhaps silently changed to Bull. Bears still expecting a leg down, but getting slightly nervous as it is not happening. Buyers now need to ignite and build both momentum and volume to break the overhead Resistance and turn into an emerging Bull.
Time will tell. With the Halving coming up in about 23 days there is reason to expect bullish momentum being built. Whether or not the Halving itself will be a non-event, the supply drop will manifest in the price like it always does.
In a Nutshell
Any break of $7,475 might lead to a strong breakout, a break & hold above $8,000 would be considered very bullish and increase chances of a major spike, wiping out Bears and igniting the new rally. Anyhow, the Daily EMA Cluster above needs to be broken first [7,600 - $7,900]. Any pump failure could lead to a violent reversal down, so caution is advised. Both a violent dump and as well as a strong spike upwards would make lots of sense in the current market, and I would not be surprised by seeing either of it or even both happening.
When the market finally decides for one direction, expect intense volatility and speed of moves.
May the Market be with you,
CY


appreciate your analysis - fits my TA well - and makes sense of current PA